
UHC’s medical loss ratio an eye-opening reminder of impact of V28 of CMS-HCCs—for payers and providers


By Jason Jobes, VP of Solutions
You want to read something scary? UHC said their 2024 full year medical loss ratio (MLR) was 85.5% compared to 83.2% in 2023. That 2.3 percentage point increase is nearly the same percent as the V28 impact in 2024.
For those who have been following me over the past two years, we have talked about the impact that V28 was going to have on reimbursement. UHC’s earnings report is the best gauge of some of the influences it is having in the broader healthcare market. In fact, United said “the increase was primarily due to previously discussed items, including the revenue effects of CMS’s Medicare funding reductions.”
In 2023 I said that the V28 would impact UHC the most because of their massive market share. The increase in medical loss ratio effectively removed $9B from UHC’s bottom line. That means less profit for them (which many will celebrate), but it also means less for patient care and provider compensation. I would expect renewed pressure to cut claims expenses.
Additionally, were I a wagering individual, we’re going to see more prior-auth pain and downward pressure on payment rates to providers. It is a call to improve health and decrease utilization.
As a reminder, 2023 dates of service were the beginning of the V28 impact to Medicare Advantage payments. The full model impact won’t be seen until UHC releases these same earnings in January 2027.
What is MLR and why should you care?
I recognize that not everyone feels like fractions are their friends. I am a math guy and love breaking down information into bite-sized chunks to help understand things. Ratios are perfect for being broken into two parts. The top number is the numerator and the bottom number is the denominator. Both play a crucial role in this metric but also quality metrics like observed to expected (O/E) ratios.
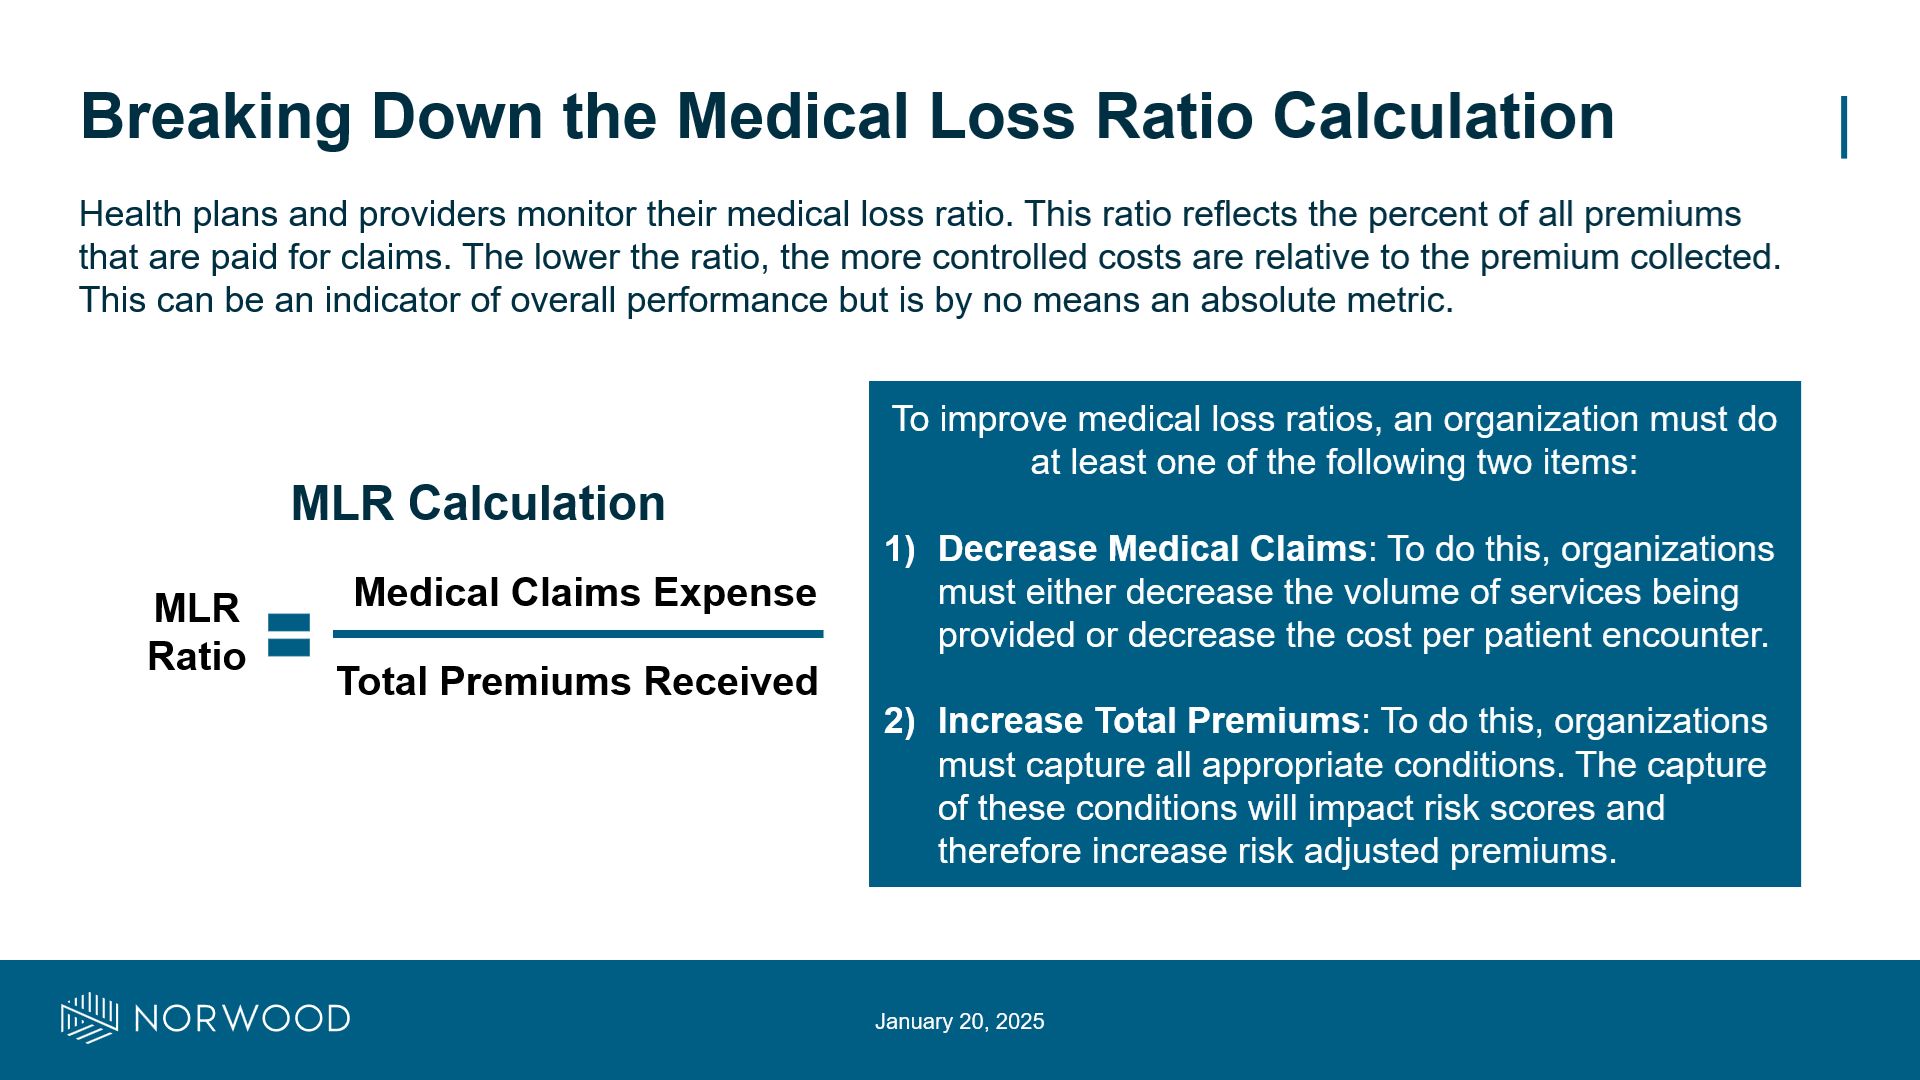
Medical Loss Ratio (MLR): MLR is a calculation that shows what percent of premiums received are going to medical expenses. A higher ratio means that a larger percent of the premiums received are being spent on medical claims. A lower ratio means that expenses are lower, but it should be noted that too low is also a sign of concern.
The MLR is an easy way to directionally gauge performance, although it isn’t an absolute metric. It does allow comparison across time periods (are you improving or getting worse) and directional comparison across other payers or groups.
To understand how to improve a ratio like this, my friend and former colleague Steve Strode and I would focus on the numerator and the denominator of the metric. This goes for so many different metrics that are out there. Anytime you see a % you can think about it in this manner.
Numerator: In the graphic below, the numerator is the claims expense. One way to improve, or reduce, the MLR is to reduce the claims expense. To do that you need to either decrease utilization or decrease the cost per encounter. The goal is to do this by keeping people healthy so that they seek care less often. Sometimes this decrease in utilization comes from authorization denials. The other piece is decreasing the cost per unit which is often done by taking care of people at cheaper care sites (i.e. urgent care vs. ED).
Denominator: This is the bottom number of a ratio. In this case the way to change the premiums is often through documentation tied to risk adjustment. For MA plans this is done by capturing HCCs which drive premiums.
In ratios it is important to note that volume isn’t a reason for most performance. I hear “oh we performed badly because the sample size was small.” That isn’t a valid argument. A ratio takes that into account. If you say, “oh I will raise premiums by adding more members” then you have to note that you will also raise expenses as well. Focus on the top and bottom numbers and what they measure to help drive change.
Organizations, both payers and providers, with exposure to Medicare should be diligent in this space. If you aren’t familiar with the changes, the impacts, and what your specific organization should be doing, we should talk.
What tactics do you take to drive improvement on ratios like MLR? What other metrics does this concept of numerator and denominator come into play?
I would love to hear from you, even to chat informally. Send me an email at jason@norwood.com.
Reference
- UnitedHealth Group Reports 2024 Results: https://www.unitedhealthgroup.com/content/dam/UHG/PDF/investors/2024/2025-16-01-uhg-reports-fourth-quarter-results.pdf
Related News & Insights
3 things to know about the 2027 IPPS proposed rule
By Brian Murphy The 2027 IPPS proposed rule is out… here’s 3 things I found interesting. (There…
A must watch: New CMS video signals new metric for Medicare Advantage
By Jason Jobes The 2027 Medicare Advantage final rate notice is out—and the buzz is everywhere. Let…